Use a Chart widget to view an instrument at a chosen timeframe and presentation.
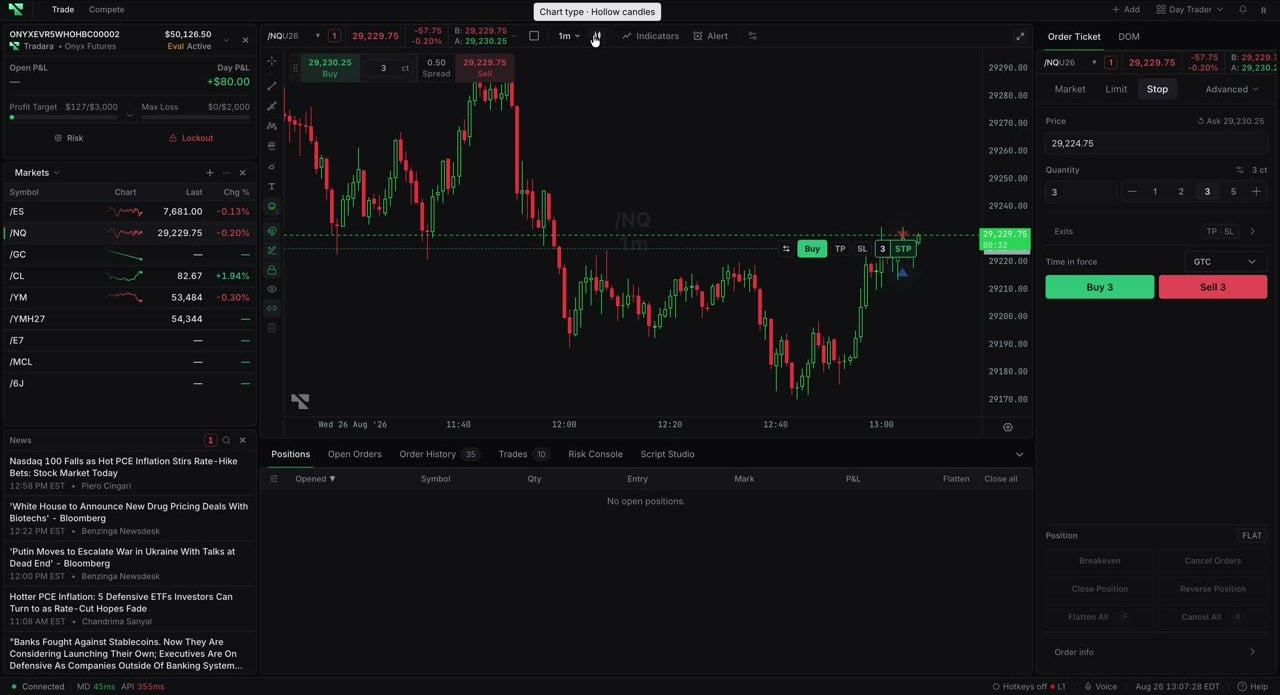
An instructional video will be added here to illustrate how to properly utilize a Tradara chart.
Select the symbol control, search, and choose the exact exchange and contract. Select the timeframe label for a preset under Seconds, Minutes, Hours, or Days. Use Add custom interval… for a positive whole length and supported unit, and star intervals for Favorites.
Select the chart-type icon next to the timeframe. Enabled choices include bar and candle, line and area, column and high-low, and transformed types such as Renko, Line break, Kagi, Point & figure, and Range. Star a type to pin it.
Scroll to zoom, drag horizontally to inspect history, and drag the price scale to change the vertical range. Select Scroll to realtime to return to the live edge. Right-click and choose Reset chart view to restore the default viewport.
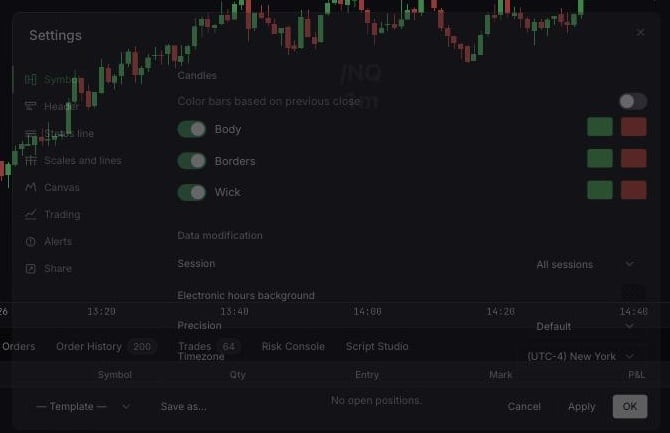
Open Chart settings. Use Symbol, Status line, Scales and lines, Canvas, Trading, Alerts, and Share as needed. Select Apply or OK.
For chart-specific setup after adding multiple charts to a workspace, set each chart's symbol, timeframe, chart type, and link group independently. New chart panes can inherit the source timeframe and chart configuration.
Confirm the exact contract and live edge before trading. Hiding trading information does not remove underlying activity. Transformed chart types are not bar-for-bar comparable with ordinary candles, and one-click trading requires explicit acknowledgement.
Use More chart controls if a header control is hidden.
Select Reset chart view if the series disappears.
Check entitlement, session status, and contract resolution if bars do not load.