Add calculated studies to a chart and manage each active instance.
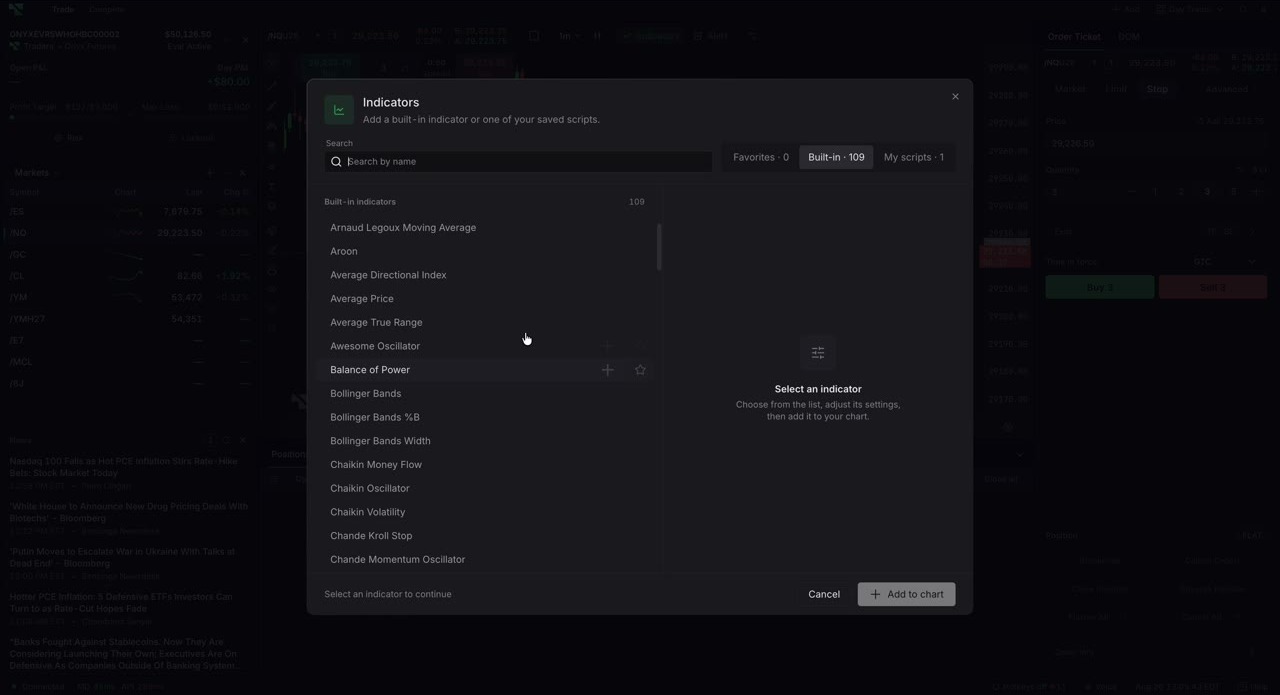
Select Indicators.
Choose Built-in, Favorites, or My scripts.
Search, review Parameters and Colors, then select Add to chart.
Use the legend to edit, hide, or remove an instance. Use Object tree to hide, remove, or reorder it.
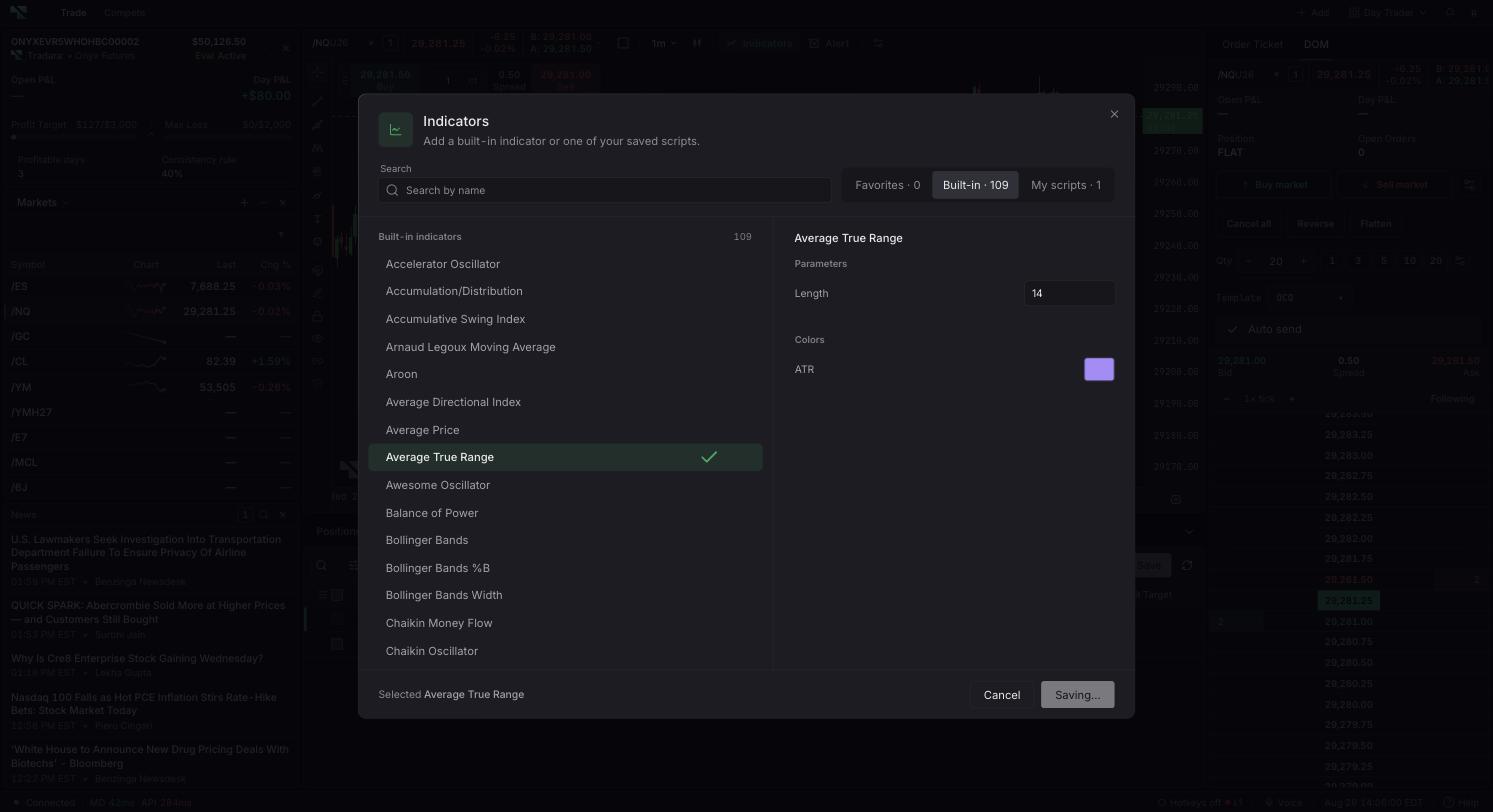
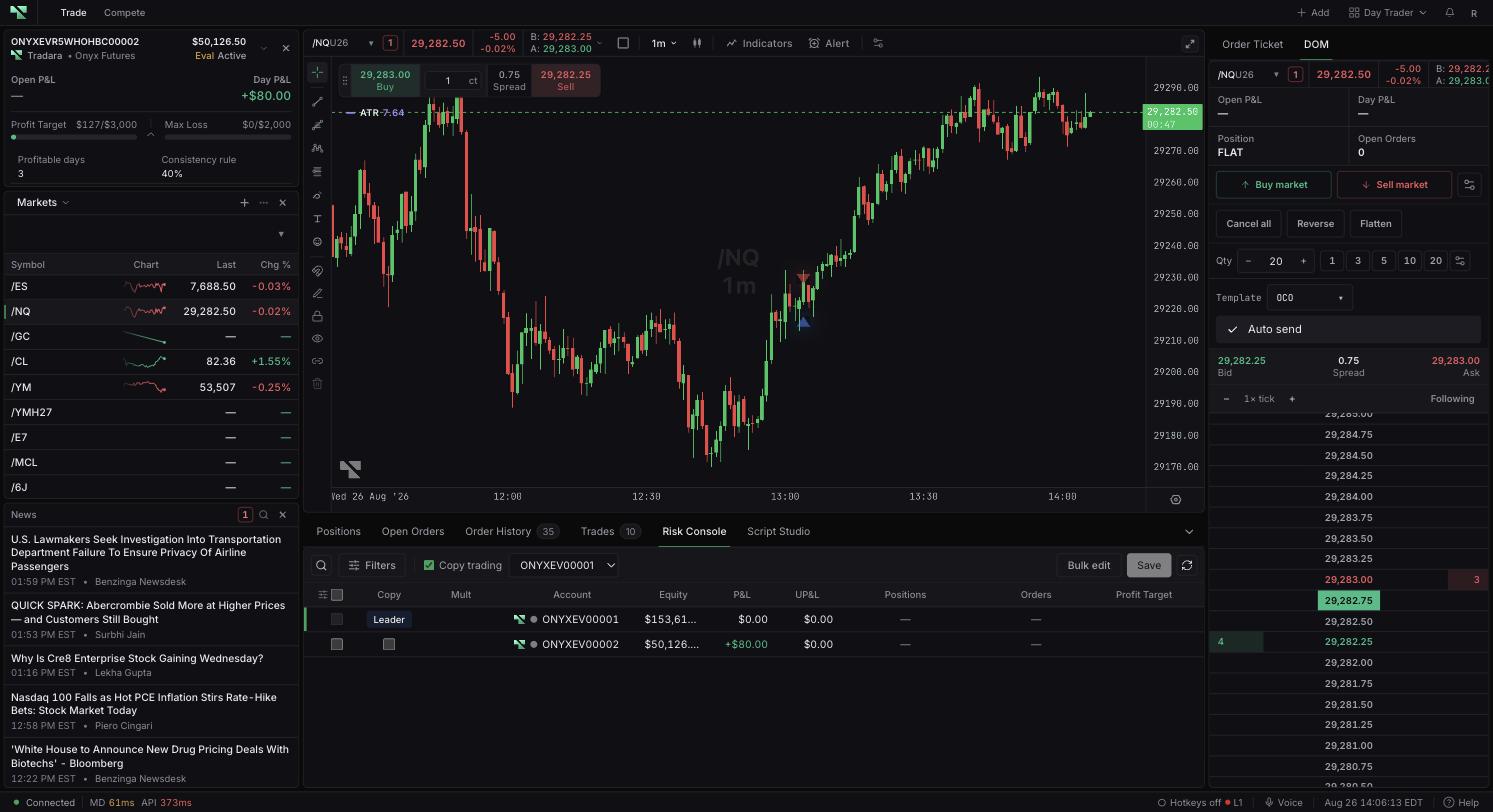
Overlay studies share the price pane. Separate studies receive panes below it. In Object tree, use Bring forward or Send backward within a pane. Reordering changes visual stacking, not calculations.
The verified core set includes EMA, SMA, VWAP, Bollinger Bands, RSI, MACD, and Volume. The authoritative available list is the Built-in tab. Star studies for Favorites; My scripts contains saved scripts.
Search Built-in for Volume and add it. Its columns align with price bars and show reported volume. Volume uses built-in up/down bars and has no adjustable parameters or plot colors in the dialog.
Search for Volume Weighted Average Price or VWAP, review its color, and add it. Tradara's built-in VWAP uses close and volume and draws over the price chart.
Only items shown under Built-in are default-available. Indicators need sufficient history, and values depend on source data, aggregation, sessions, and inputs. Volume does not identify buyer or seller intent, and VWAP does not guarantee execution near its line.
Confirm market data and load more history if a study is blank.
Check legend and Object tree visibility.
When comparing values, match the contract, session, timeframe, and parameters.