Annotate chart levels, patterns, time, and price ranges without changing market data.
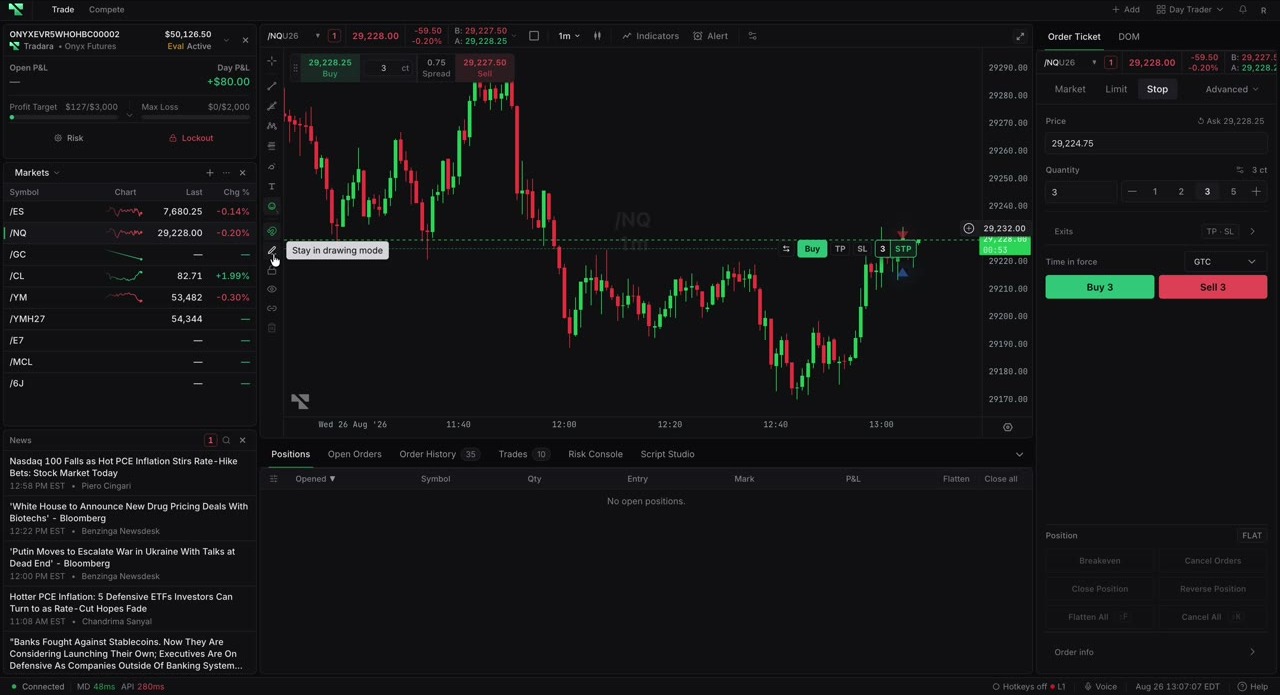
Open a tool group and choose a selectable tool.
Select its required chart points. For Path or Polyline, finish with a double-click, Enter, or Escape after at least two points.
Select the drawing to change its color, width, style, text, coordinates, or visibility through its toolbar and Settings.
Select a drawing for Clone, Lock/Unlock, Remove, or Settings. Use Object tree to find, hide, remove, or reorder drawings. Lower rail controls include Stay in drawing mode, Lock all drawings, Hide drawings, Show drawings, and Remove all drawings.
Use Trend line tools for lines, rays, angles, and channels. Horizontal line, Horizontal ray, Vertical line, and Cross line use one anchor. Under Prediction and measurement tools, choose Price range, Date range, or Date and price range, then select start and end points.
The object remains anchored to chart time and price, or a future bar offset, while you pan and zoom.
Beyond lines and ranges, the drawing rail also groups Chart patterns (triangle, head and shoulders, and related harmonic patterns), Elliott wave tools for impulse, correction, and triangle counts, Cycle tools for marking recurring time intervals, and Brushes, Arrows, Shapes, and Text and notes for free-form annotation. Each group opens the same way as the line tools, and objects from every group share the common selection, lock, clone, and remove behavior described above. Not every listed tool is active in every release; an item marked unavailable in its flyout is not yet enabled.
Drawings are annotations, not orders or risk controls. Remove all drawings is broad and cannot be assumed reversible. Measurements do not represent guaranteed fills, P&L, fees, or exchange timestamps.
Reselect the tool if clicks pan the chart.
Unlock an object if it cannot be moved or edited.
Enable Magnet — snap to price, zoom in, or edit coordinates for more precise placement.