Arrange widgets, tabbed sections, and a Matrix on the desktop workspace. Edit mode exposes structure; it does not place an order or delete content by itself.
Open the desktop Tradara Terminal. Mobile has no desktop layout-edit mode or drag-and-drop workspace editor.
An instructional video will be added here to illustrate how to properly utilize the workspace editor.
Open the workspace menu in the header.
Select Edit layout.
After you arrange the workspace, reopen the menu and select Exit edit mode.
You can move and remove widgets without Edit layout. Edit mode makes the layout structure easier to inspect.
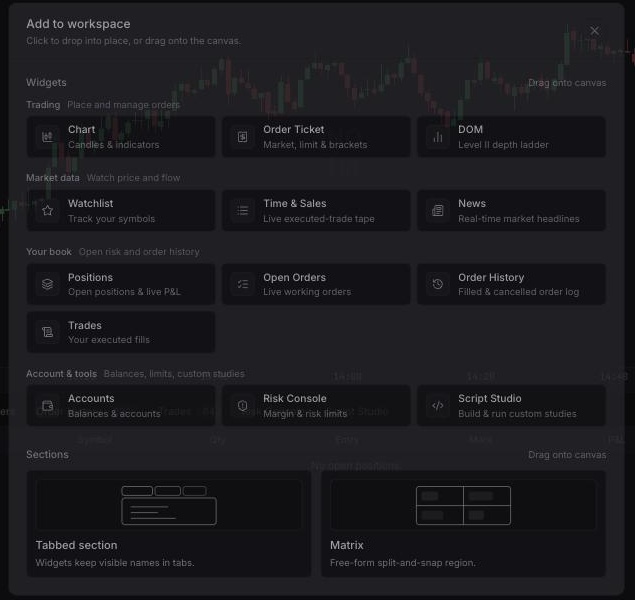
Select \+ Add in the header.
Under Widgets, click a card to place it automatically, or drag it onto the canvas.
Drag a widget header or empty widget space to move it.
Drag a divider in a Matrix to resize neighboring areas.
Use the widget header menu when a widget supports maximize.
Right-click a widget and choose the remove action, or use its close control.
Most market-facing widgets can be placed repeatedly, so you can watch several instruments side by side. Account-global tools are singletons, because they always report on the account currently selected in the header.
Open \+ Add.
Add as many Chart, Order Ticket, DOM, Time & Sales, Positions, Open Orders, Order History, Trades, News, or Watchlist widgets as you need.
Keep a single Trade Copier, Script Studio, and Accounts widget.
If adding a singleton appears to do nothing, it is already open somewhere else — check your other tabs and sections, or use the account strip in the header.
Select \+ Add.
Under Sections, choose Tabbed section or Matrix.
Click to add automatically, or drag the section onto the canvas.
Add or move widgets into the new section.
A Tabbed section stacks widgets behind named tabs. A Matrix creates a split-and-snap region with multiple visible areas. Tradara confirms Tabbed section added or Matrix added. When the root is a single widget, drag the section onto the canvas instead of clicking.
Workspace history covers structural layout changes such as adding, moving, and rearranging content.
Make a layout change.
Press ⌘Z to undo it.
Press ⇧⌘Z on macOS or Ctrl+Y on Windows to redo when available.
Select \+ Add, then add Chart more than once, or place charts in a Matrix or tabbed section.
Assign link channels based on whether charts should share a symbol.
Choose a timeframe in each chart toolbar.
To split one chart into a chart-only grid:
Open a chart in a saved workspace.
Select Chart layout at the start of the chart toolbar.
Choose a diagram under the desired pane count.
Set each new chart's symbol, timeframe, chart type, and link group as needed.
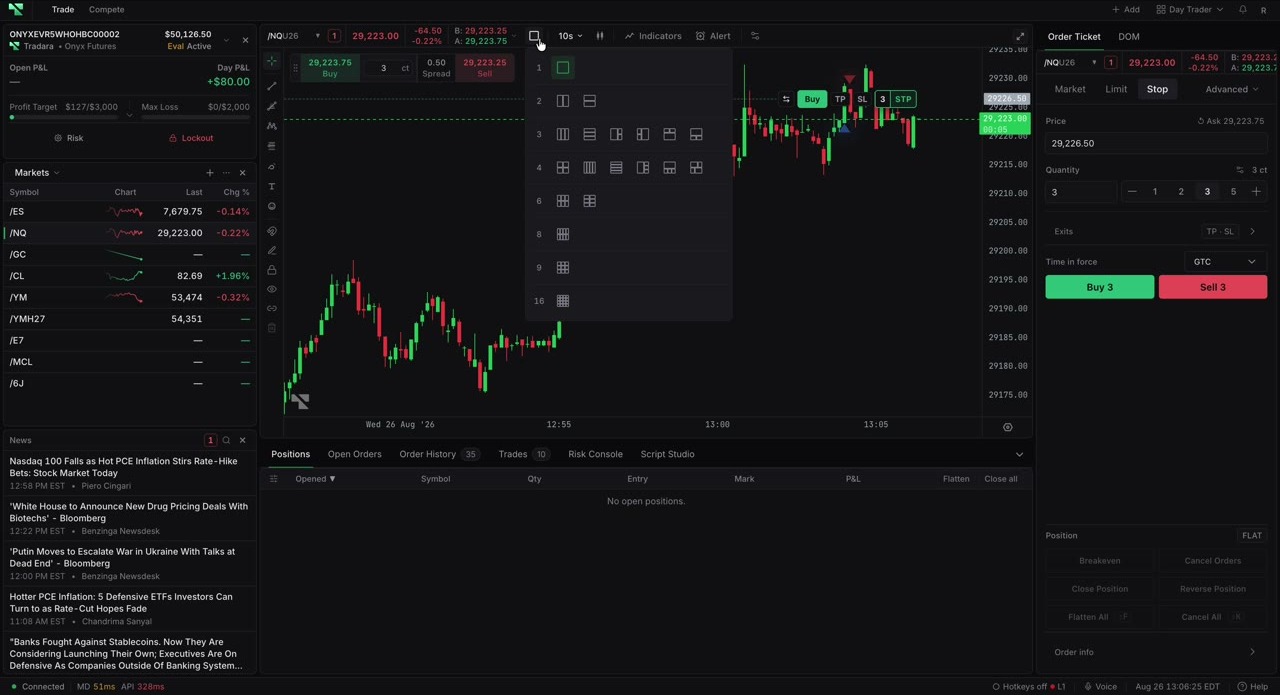
Pane 0 keeps the chart that opened the picker. Existing chart settings are recycled when possible. Newly created panes inherit the source timeframe and chart configuration, then receive link groups in sequence. The current chart-only region is replaced by the selected matrix without recursively nesting prior chart grids. Returning to the one-pane option collapses the region.
The workspace updates immediately and saves the active arrangement locally. Signed-in users also receive best-effort layout sync. Each chart keeps its own timeframe and can share or separate symbol selection by channel.
Undo does not reverse orders, account actions, remote layout deletion, or other trading operations. Not every widget supports maximize, and singleton widgets cannot be meaningfully added more than once. A workspace supports at most 16 chart widgets; layout choices beyond the remaining capacity are disabled. More live charts increase screen, rendering, and market-data work, especially with short timeframes and many indicators.
If the Edit layout label does not change, close and reopen the workspace menu.
If a card cannot be dropped where intended, click it to use automatic placement. If automatic placement is unavailable, drag to a highlighted drop target.
If undo or redo does nothing, history may be empty or focus may be inside an input. Click the workspace and retry.
If another chart cannot be added, or Chart layout options are disabled, remove unused charts or choose fewer panes.
If Chart layout is missing, confirm the chart belongs to a saved workspace rather than an embedded chart.
If the workspace becomes unusable, open the workspace menu and select Reset layout.